Is The Nasdaq Poised For A Reveal?
Jun 17, 2022
Operations manager at QuickTrade, Jacques de Beer, believes we could be seeing the beginnings of a major reversal in the market, after a nearly two-year bull market that pushed the index up 137% by November 2021.
The index then dropped 20% before resuming a rally in early March 2022. De Beer believes a deeper pullback may be on the cards.
The tech-heavy Nasdaq is a favourite trading instrument for professional traders for several reasons:
- It is volatile, with daily swings as high as 5% or more;
- It enjoys deep liquidity, allowing fast entry and exit for traders; and
- Traders can go long and short through platforms such as QuickTrade, which has the additional benefit (or disadvantage if you are in a losing trade) of amplifying your profits and losses.
“We could be seeing a reversal point in the market,” says De Beer. “I would like to see a stronger pullback before committing to going long the index.”
Hardus van Pletsen, CEO of QuickTrade, notes a marked increase in the number of clients interested in trading in recent months. “We have found in the past that when the markets drop, as they have done in recent weeks as a result of the high inflation numbers coming out of the US and the recent war in Ukraine, that traders position themselves for a possible financial market rally. This time seems to be no different.”
Fine-tuning points of entry and exit
De Beer says a useful technical tool to assess where we are in the market is to apply Fibonacci lines to determine the likely depth of a market rise or pullback.
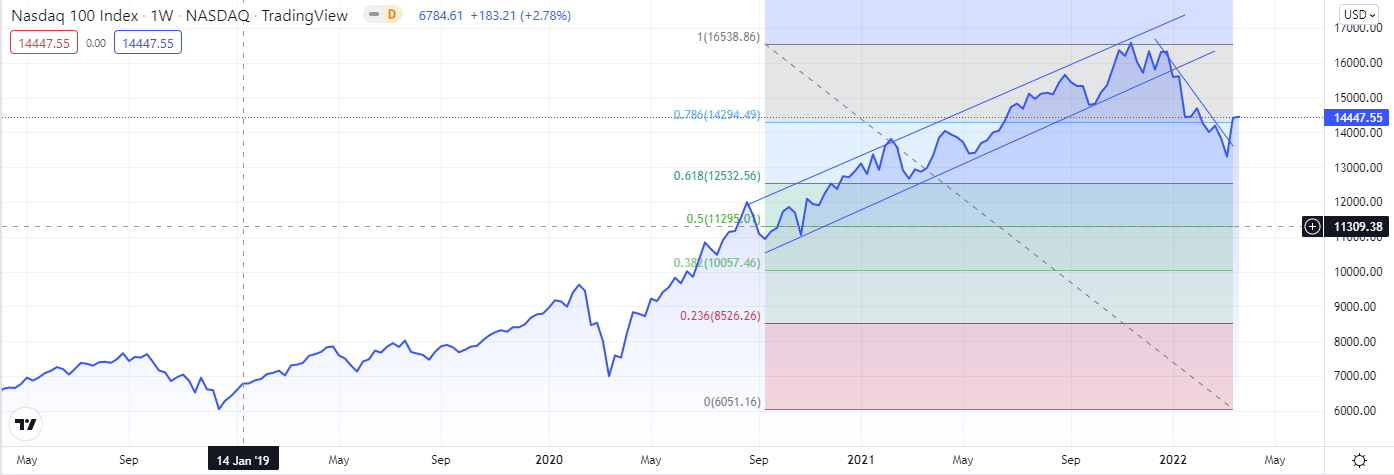
Fibonacci is a mathematical sequence developed by an Italian mathematician in the 13th Century. Fibonacci lines, as shown in the graph below, are used by many traders to fine-tune their points of entry or exit on trades, on the basis that these lines represent likely areas of support or resistance.
In the graph below, the Fibonacci lines are shown as different coloured bars, representing pullbacks of about 23% (grey), 38% (light blue) and 50% (green) from the November peak. These levels are keenly watched by traders as potential points of reversal.
Nasdaq index

“We saw a 20% pullback in price from the November peak, followed by a rally of about 9%,” says De Beer.
“I would like to see a deeper pullback so we hit the 38% Fibonacci level before committing too heavily to the Nasdaq. Also, bear in mind that we are entering a period of rising interest rates, which is typically negative for stocks, and there is a very real fear that we are on the cusp of economic contraction, due in large part to the high energy prices brought on by the war in Ukraine.”
Consequently, we may see some dead-cat bounces in the Nasdaq over the coming months, followed by aggressive retractions in prices.
That said, it’s never a good idea to short the Nasdaq for any length of time, as the following chart, extending back to 2007, proves.
Nasdaq index over the longer term

A bear market in the Nasdaq is a rare occurrence but when it has occurred in the past, it’s been long and brutal.
In March 2000, exactly 22 years ago, the Nasdaq index entered a nine-year bear market that ended in 2009. This bear market followed the tech market bust that saw dozens of listed companies disappear, before the likes of Amazon, Google and Apple returned some respectability to the tech space.
“The Nasdaq has been on a tremendous bull run for several years, so one should never bet too heavily against that trend,” says De Beer. “That said, I do see the potential for a trend reversal at this point, and it is hard to see what would push it back above its previous high reached in November last year.”
Trading the Nasdaq using CFDs
QuickTrade clients are able to trade the Nasdaq using a derivative instrument known as a contract for difference or CFD. This allows the trader to benefit from the price movement in the index, and with leverage of up to 30:1. There is risk in doing this, as any losses or profits are amplified when leverage is applied to a trading position.
Traders should also take care not to commit too much to a single trade, and should assess how much of their capital they are prepared to lose on a single trade.
View original article here: Is the Nasdaq poised for a reversal?
Our Source: Is the Nasdaq poised for a reversal?


